Get the latest nursing statistics & demographics in the US
Total US Nursing Population
2,824,641 Registered Nurses (RNs) in the US
690,038 Licensed Practical Nurses (LPNs) in the US
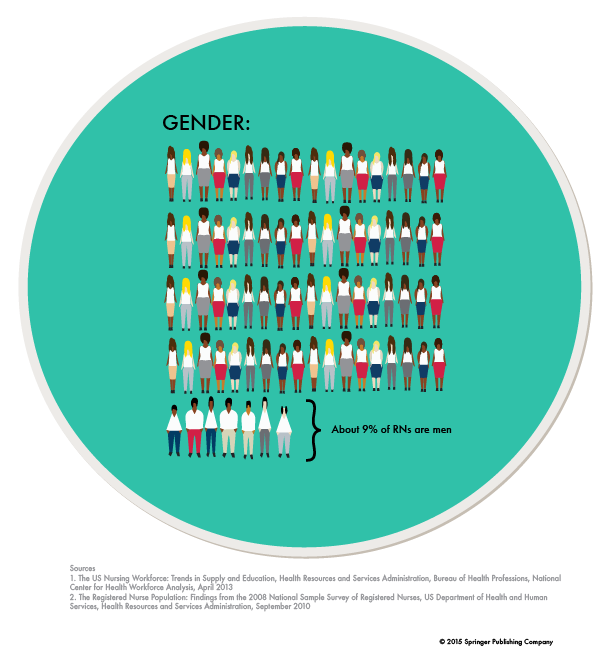
Gender Statistics
LPNs and RNs by Age

The median age for male RNs licensed in 2000 or later is 35, compared with 31 for female RNs.
- 43.6 = average age of LPNs in the US
- 18.3% = percent of LPNs 30 years old or younger
- 44.6 = average age of an RN in the US
- 14.8% = percent of RNs 30 years old or younger
Download the Infographic (LPNs)
Download the Infographic (RNs)
Download the Infographic (Job Satisfaction)
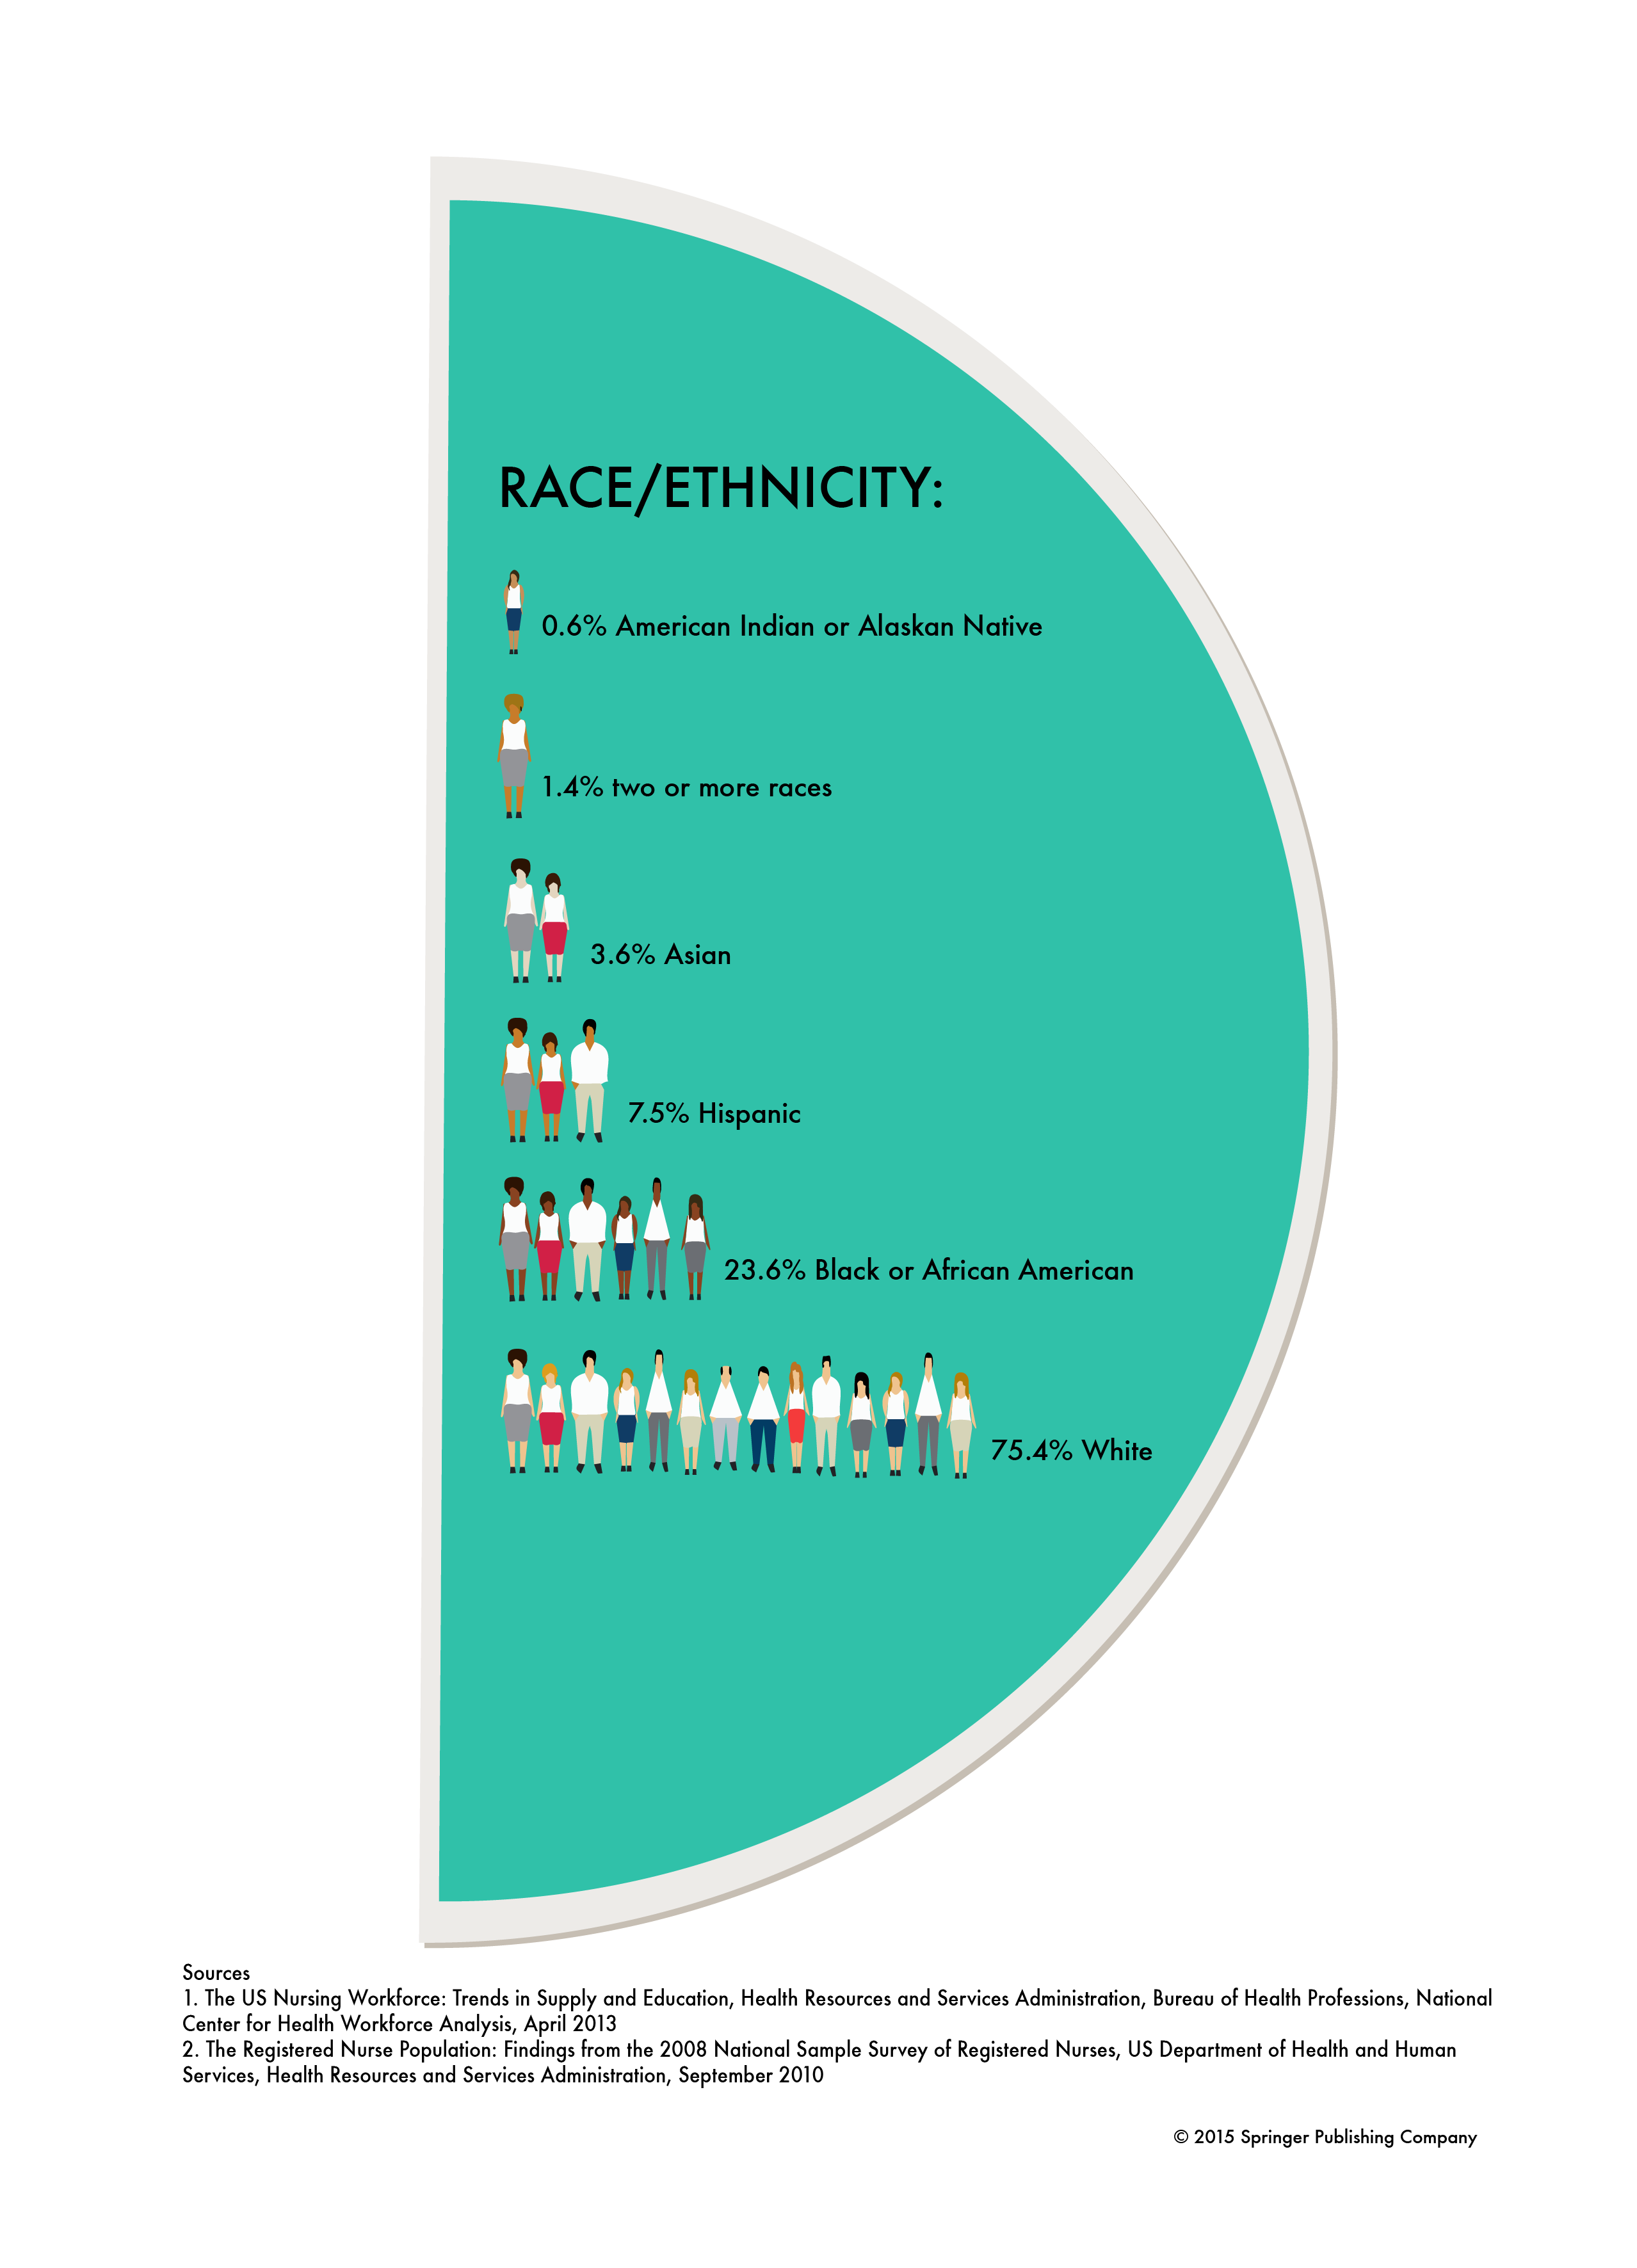
Race and Ethnicity Statistics
How many nurses identify themselves as black (non-Hispanic)? • There are about 279,600 black RNs and 162,800 LPNs.
How many nurses self-identify as Hispanic or Latino? • There are approximately 135,600 Hispanic/Latino RNs and 51,800 LPNs.
How many nurses identify themselves as Asian? • There are about 234,400 Asian RNs and 24,800 LPNs.
How many nurses identify themselves as American Indian or Alaskan Native? • There are about 11,300 American Indian/Alaskan Native RNs and 4,100 LPNs.
Which region of the US has the largest number of minority nurses? • The Pacific region has the highest percentage of minority nurses, with 30.5% of nurses identifying themselves as belonging to a minority.
What is the largest minority nurse group in the Pacific region? • The predominant minority nurse group in the Pacific is those of Asian background; 16% of the nurse population. Asian nurses were also more likely to be a part of the nurse population in the Middle Atlantic and West South Central areas — 7.3% and 5.6%, respectively — than in other parts of the country.
In which region(s) of the US would one find the largest number of black and/or African American nurses? • Black or African American (non-Hispanic) nurses were more prevalent among the nurse population in the South Atlantic (9.5%), West South Central (8.8%), and East South Central (7.7%) areas than anywhere else.
In which region(s) is one most likely to be a Hispanic or Latino nurse? • Hispanic or Latino nurses were more likely to be found among the nurses in the West South Central (7.8%), Pacific (6.7%), and Mountain (6.1%) areas.
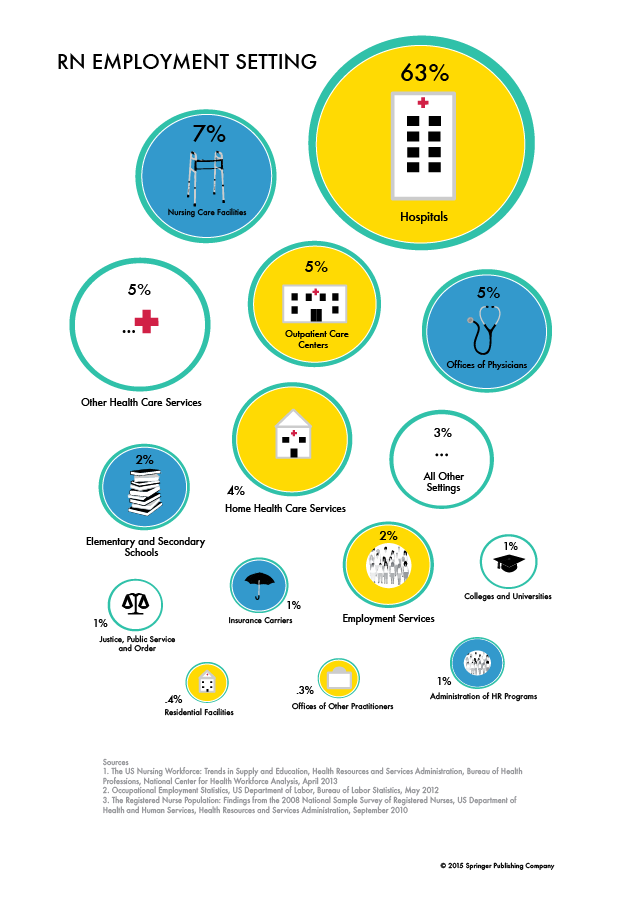
Employment Statistics
Nearly 85% of the RN population, or about 2,596,600 RNs, are employed in nursing.
Download the Infographic (RN Employment Setting)
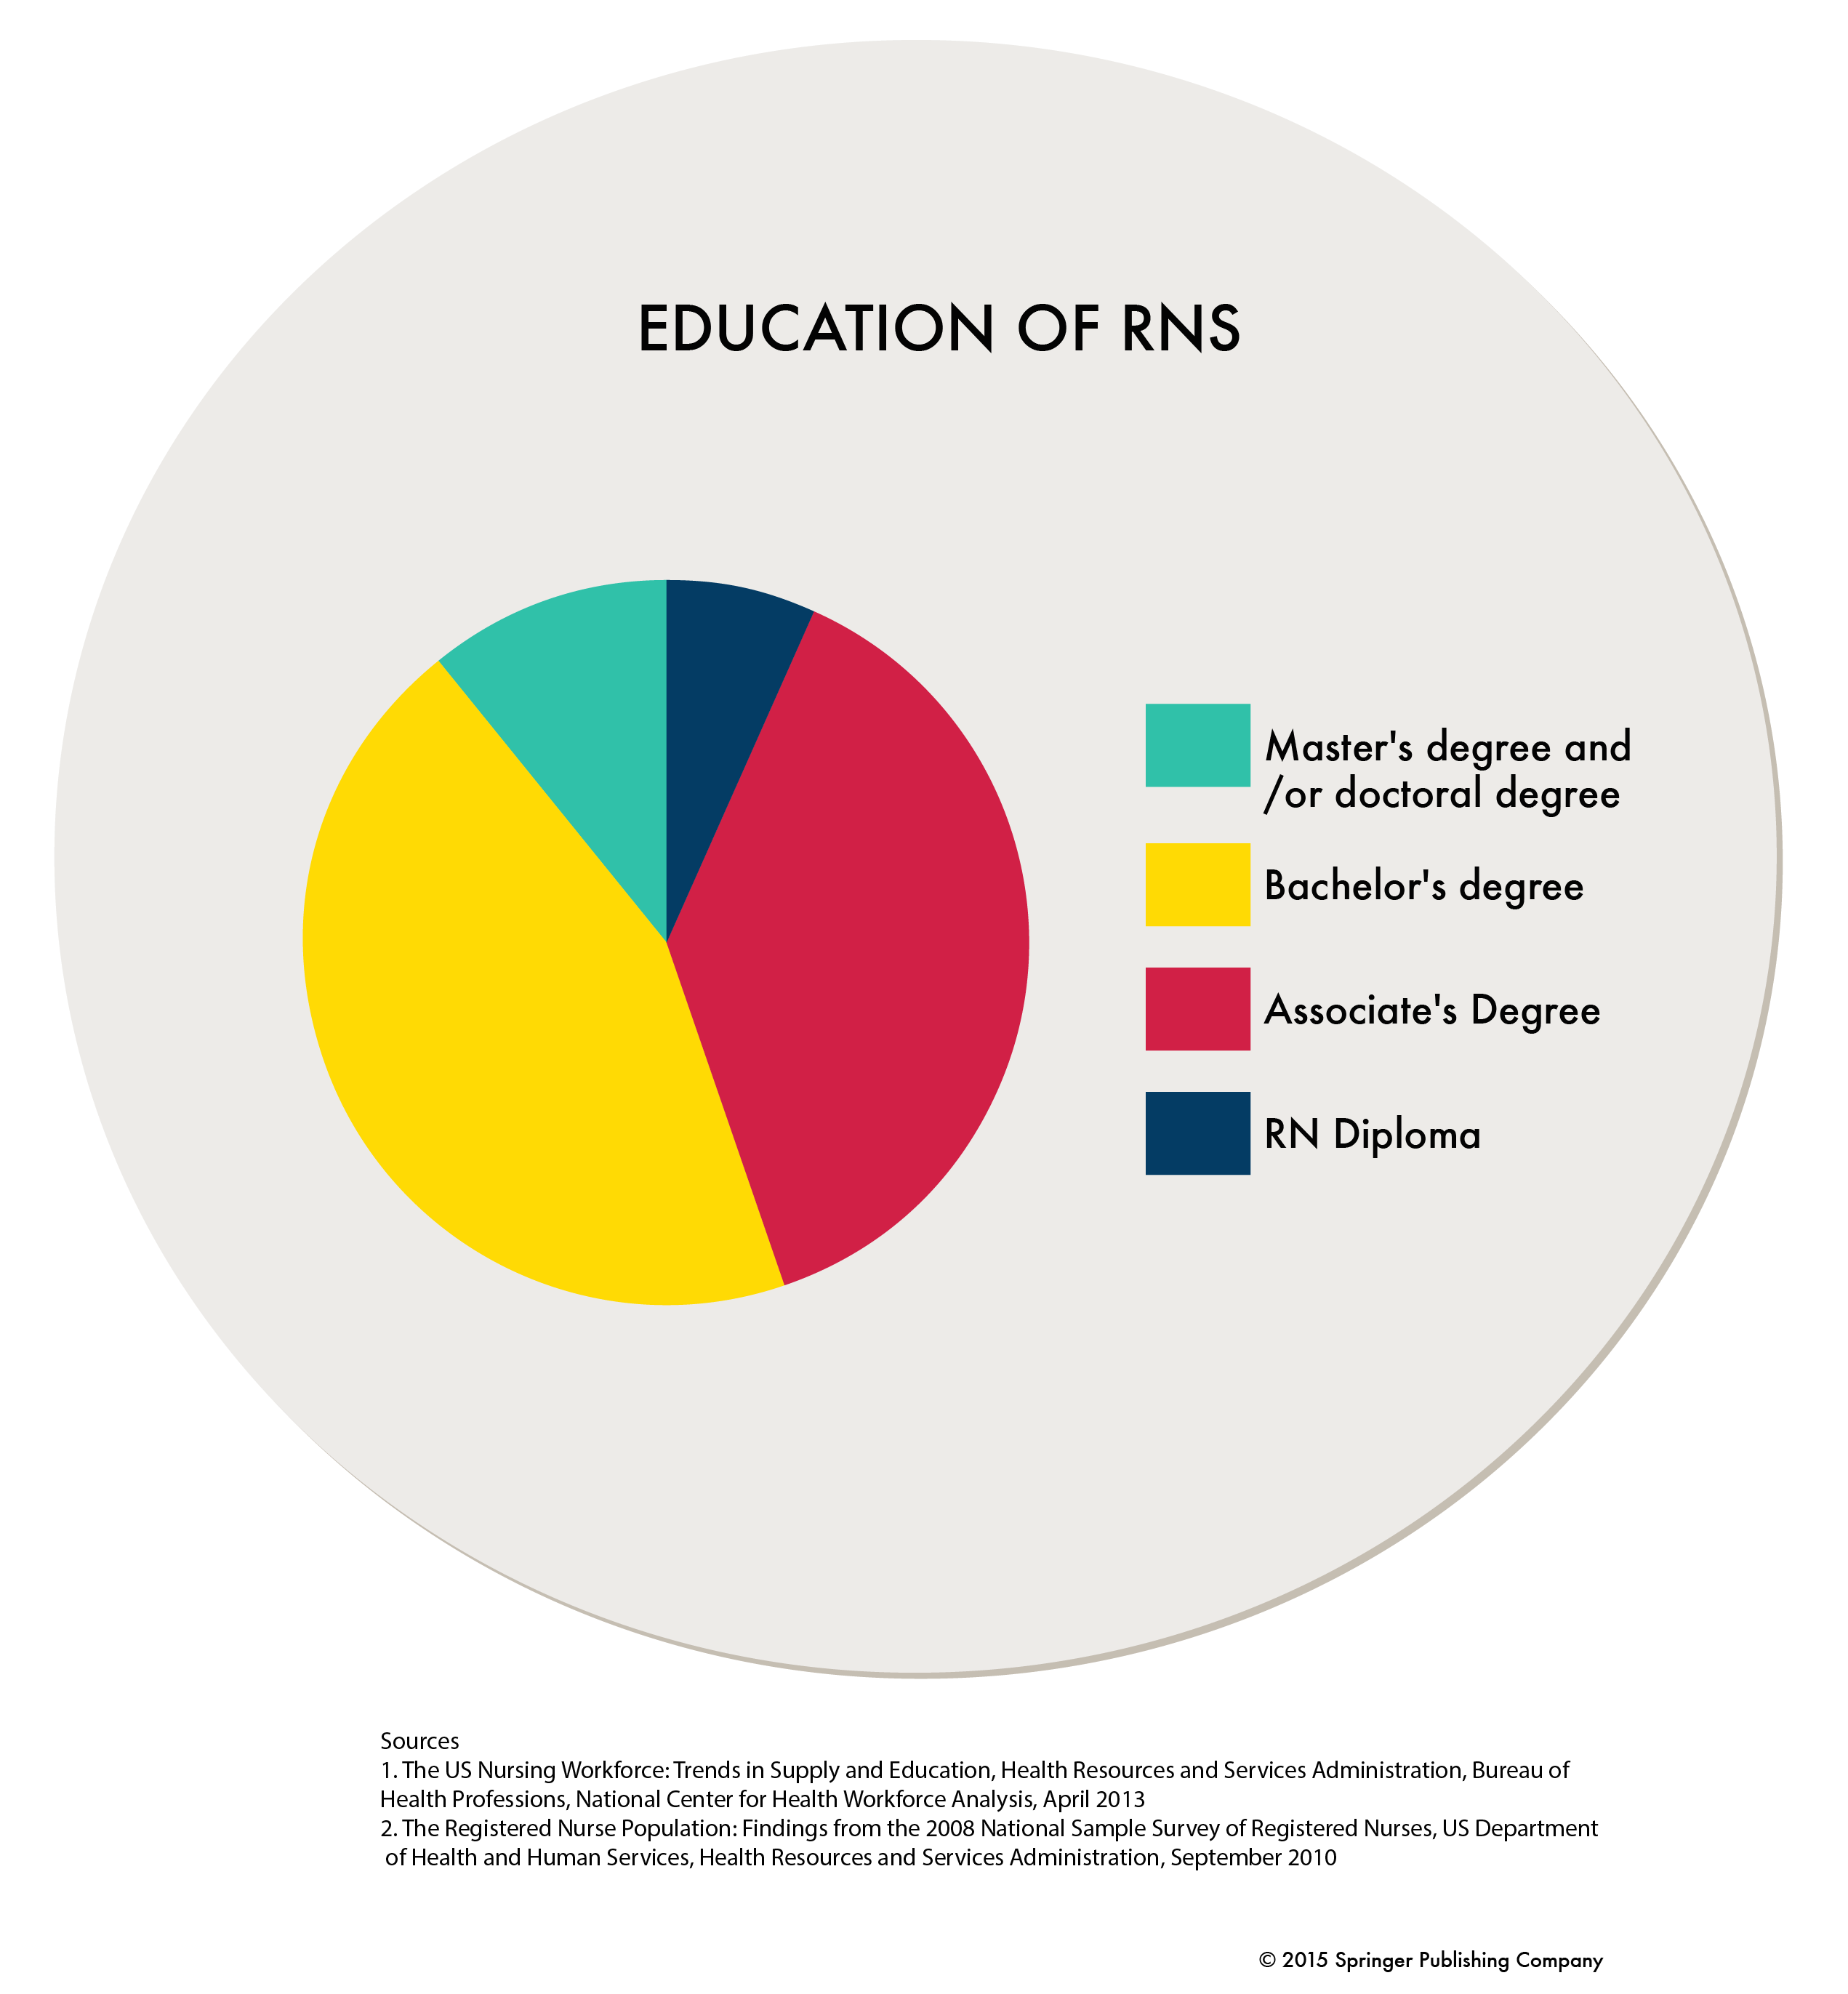
Education Statistics
Which nursing group is most likely to have a bachelor’s degree? • Asian/Pacific Islander nurses are more likely than all other nurses to have entered the profession with a bachelor’s degree — 69.6% of Asian RNs entered the profession with a bachelor’s or higher degree.
14.6% of black or African-American nurses have related master’s or doctoral degrees, compared to 13.4% of white nurses.
Download the Infographic
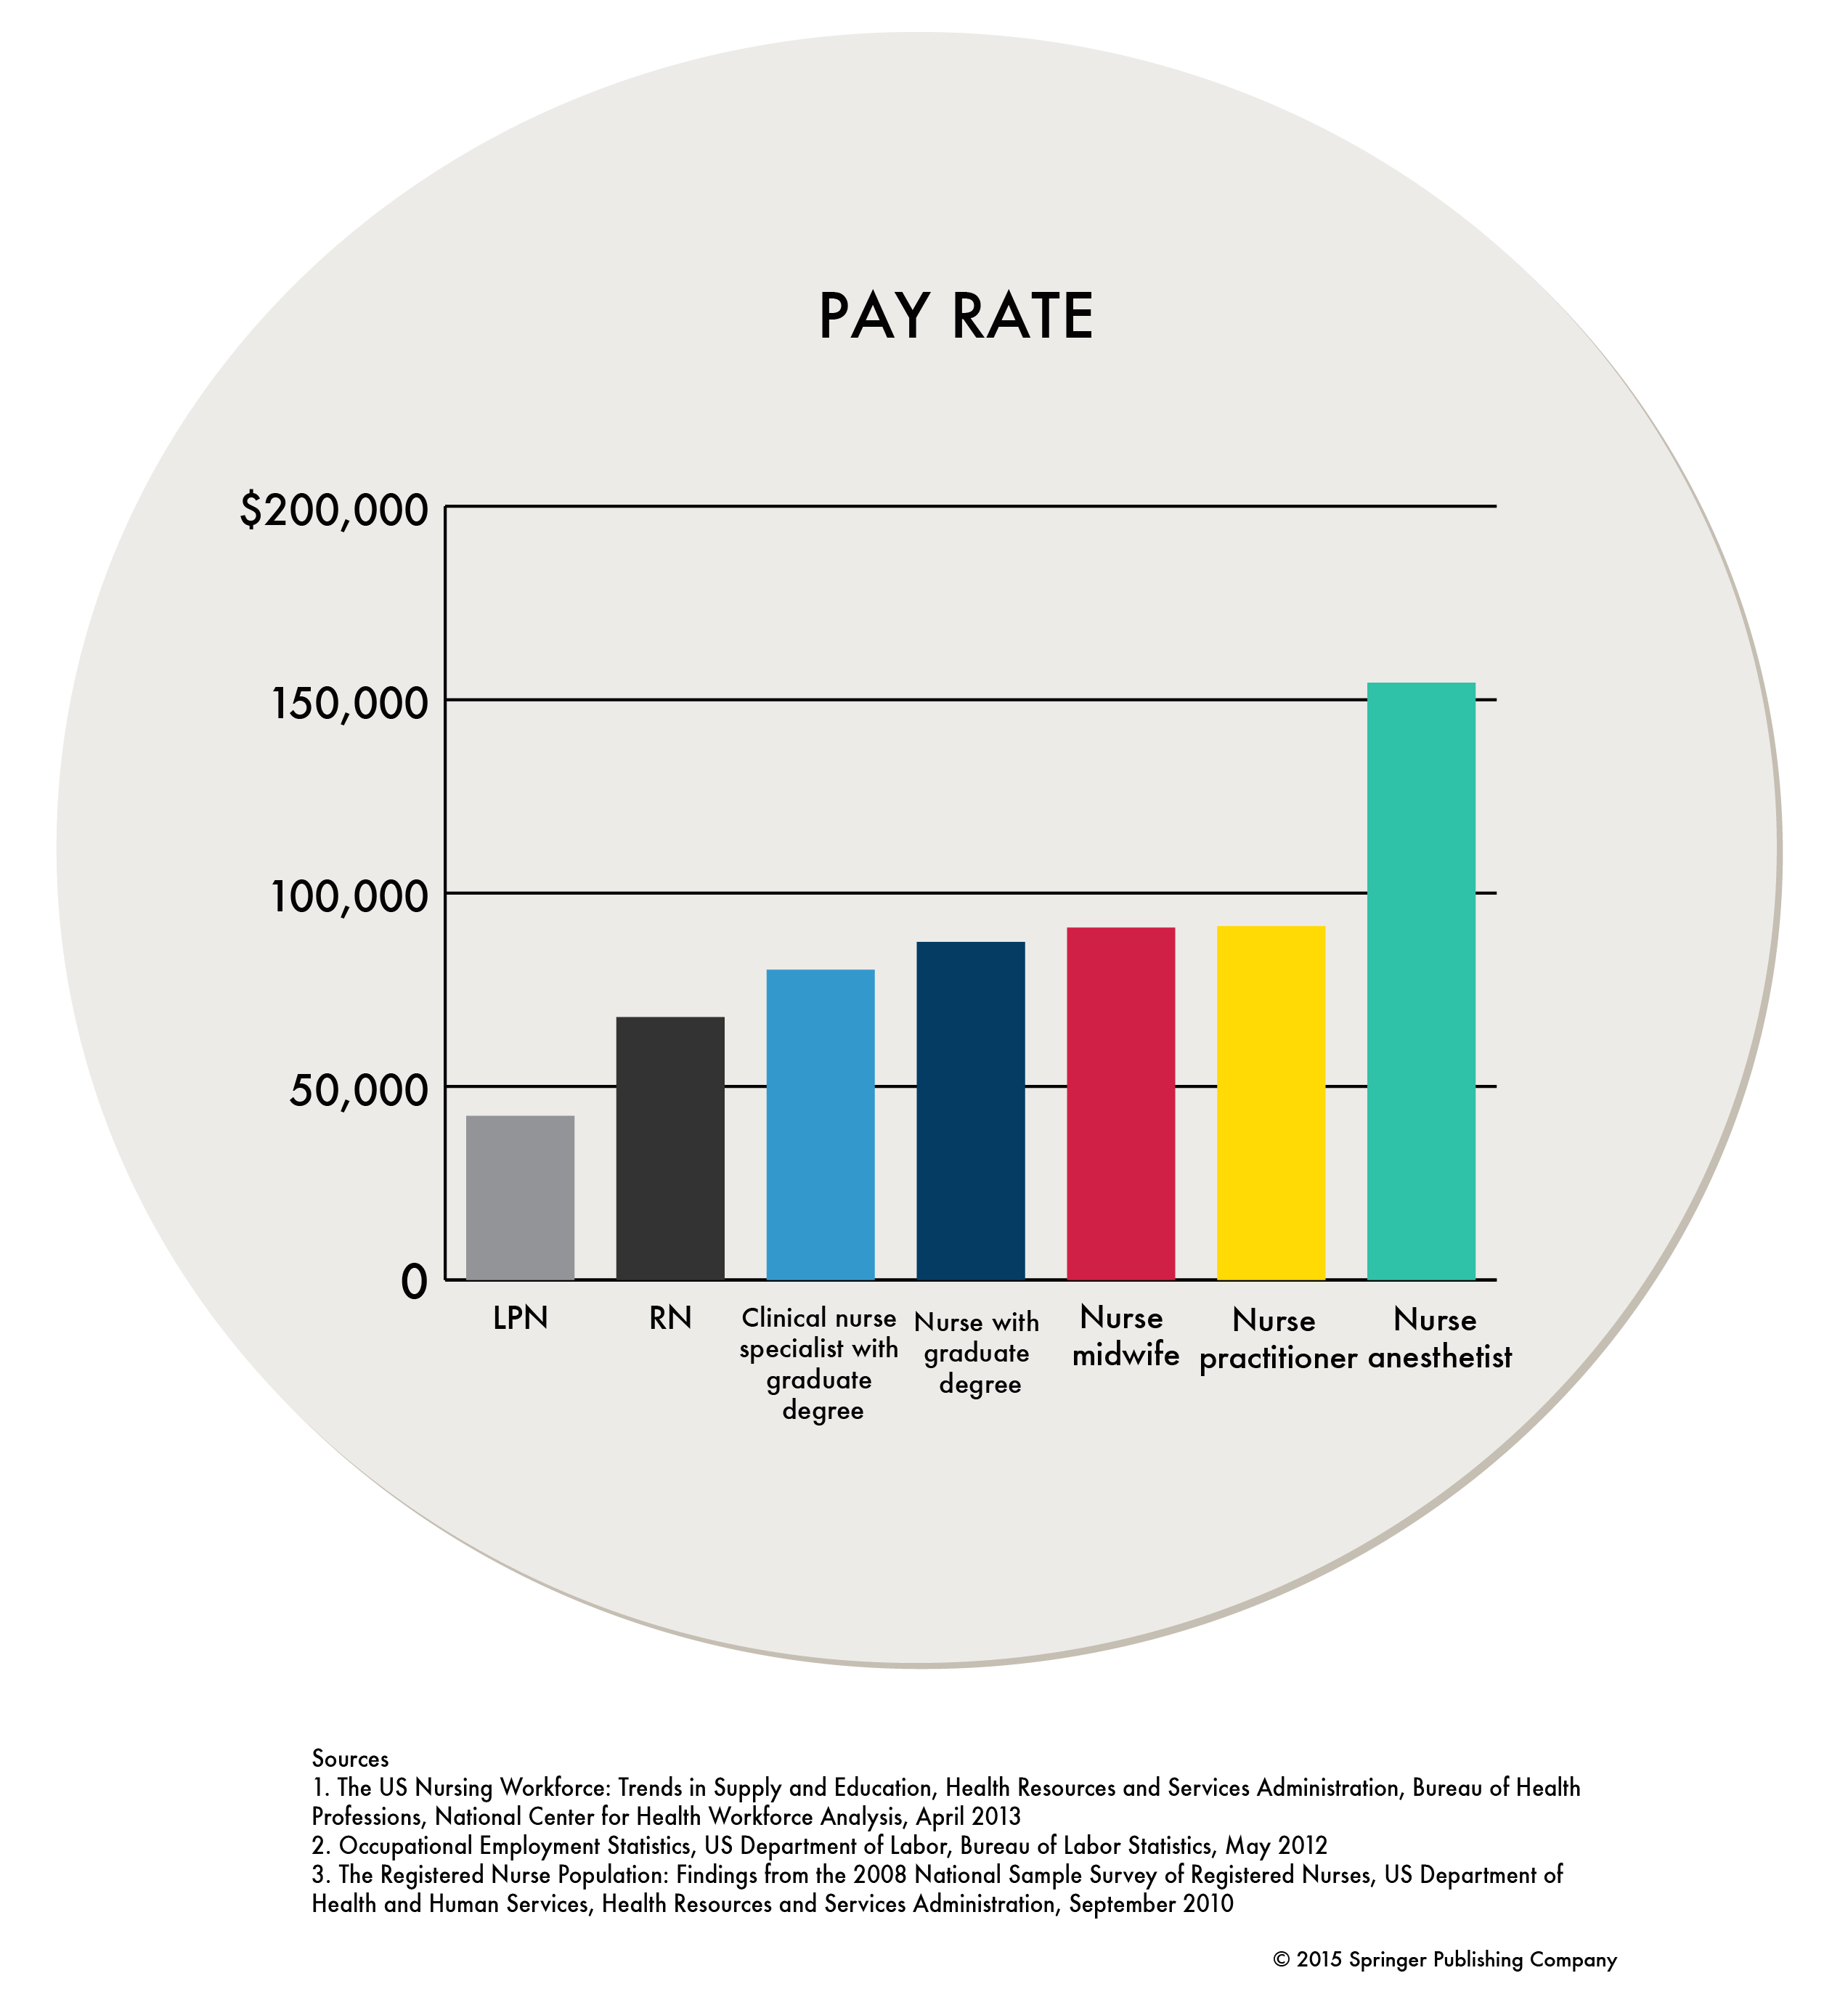
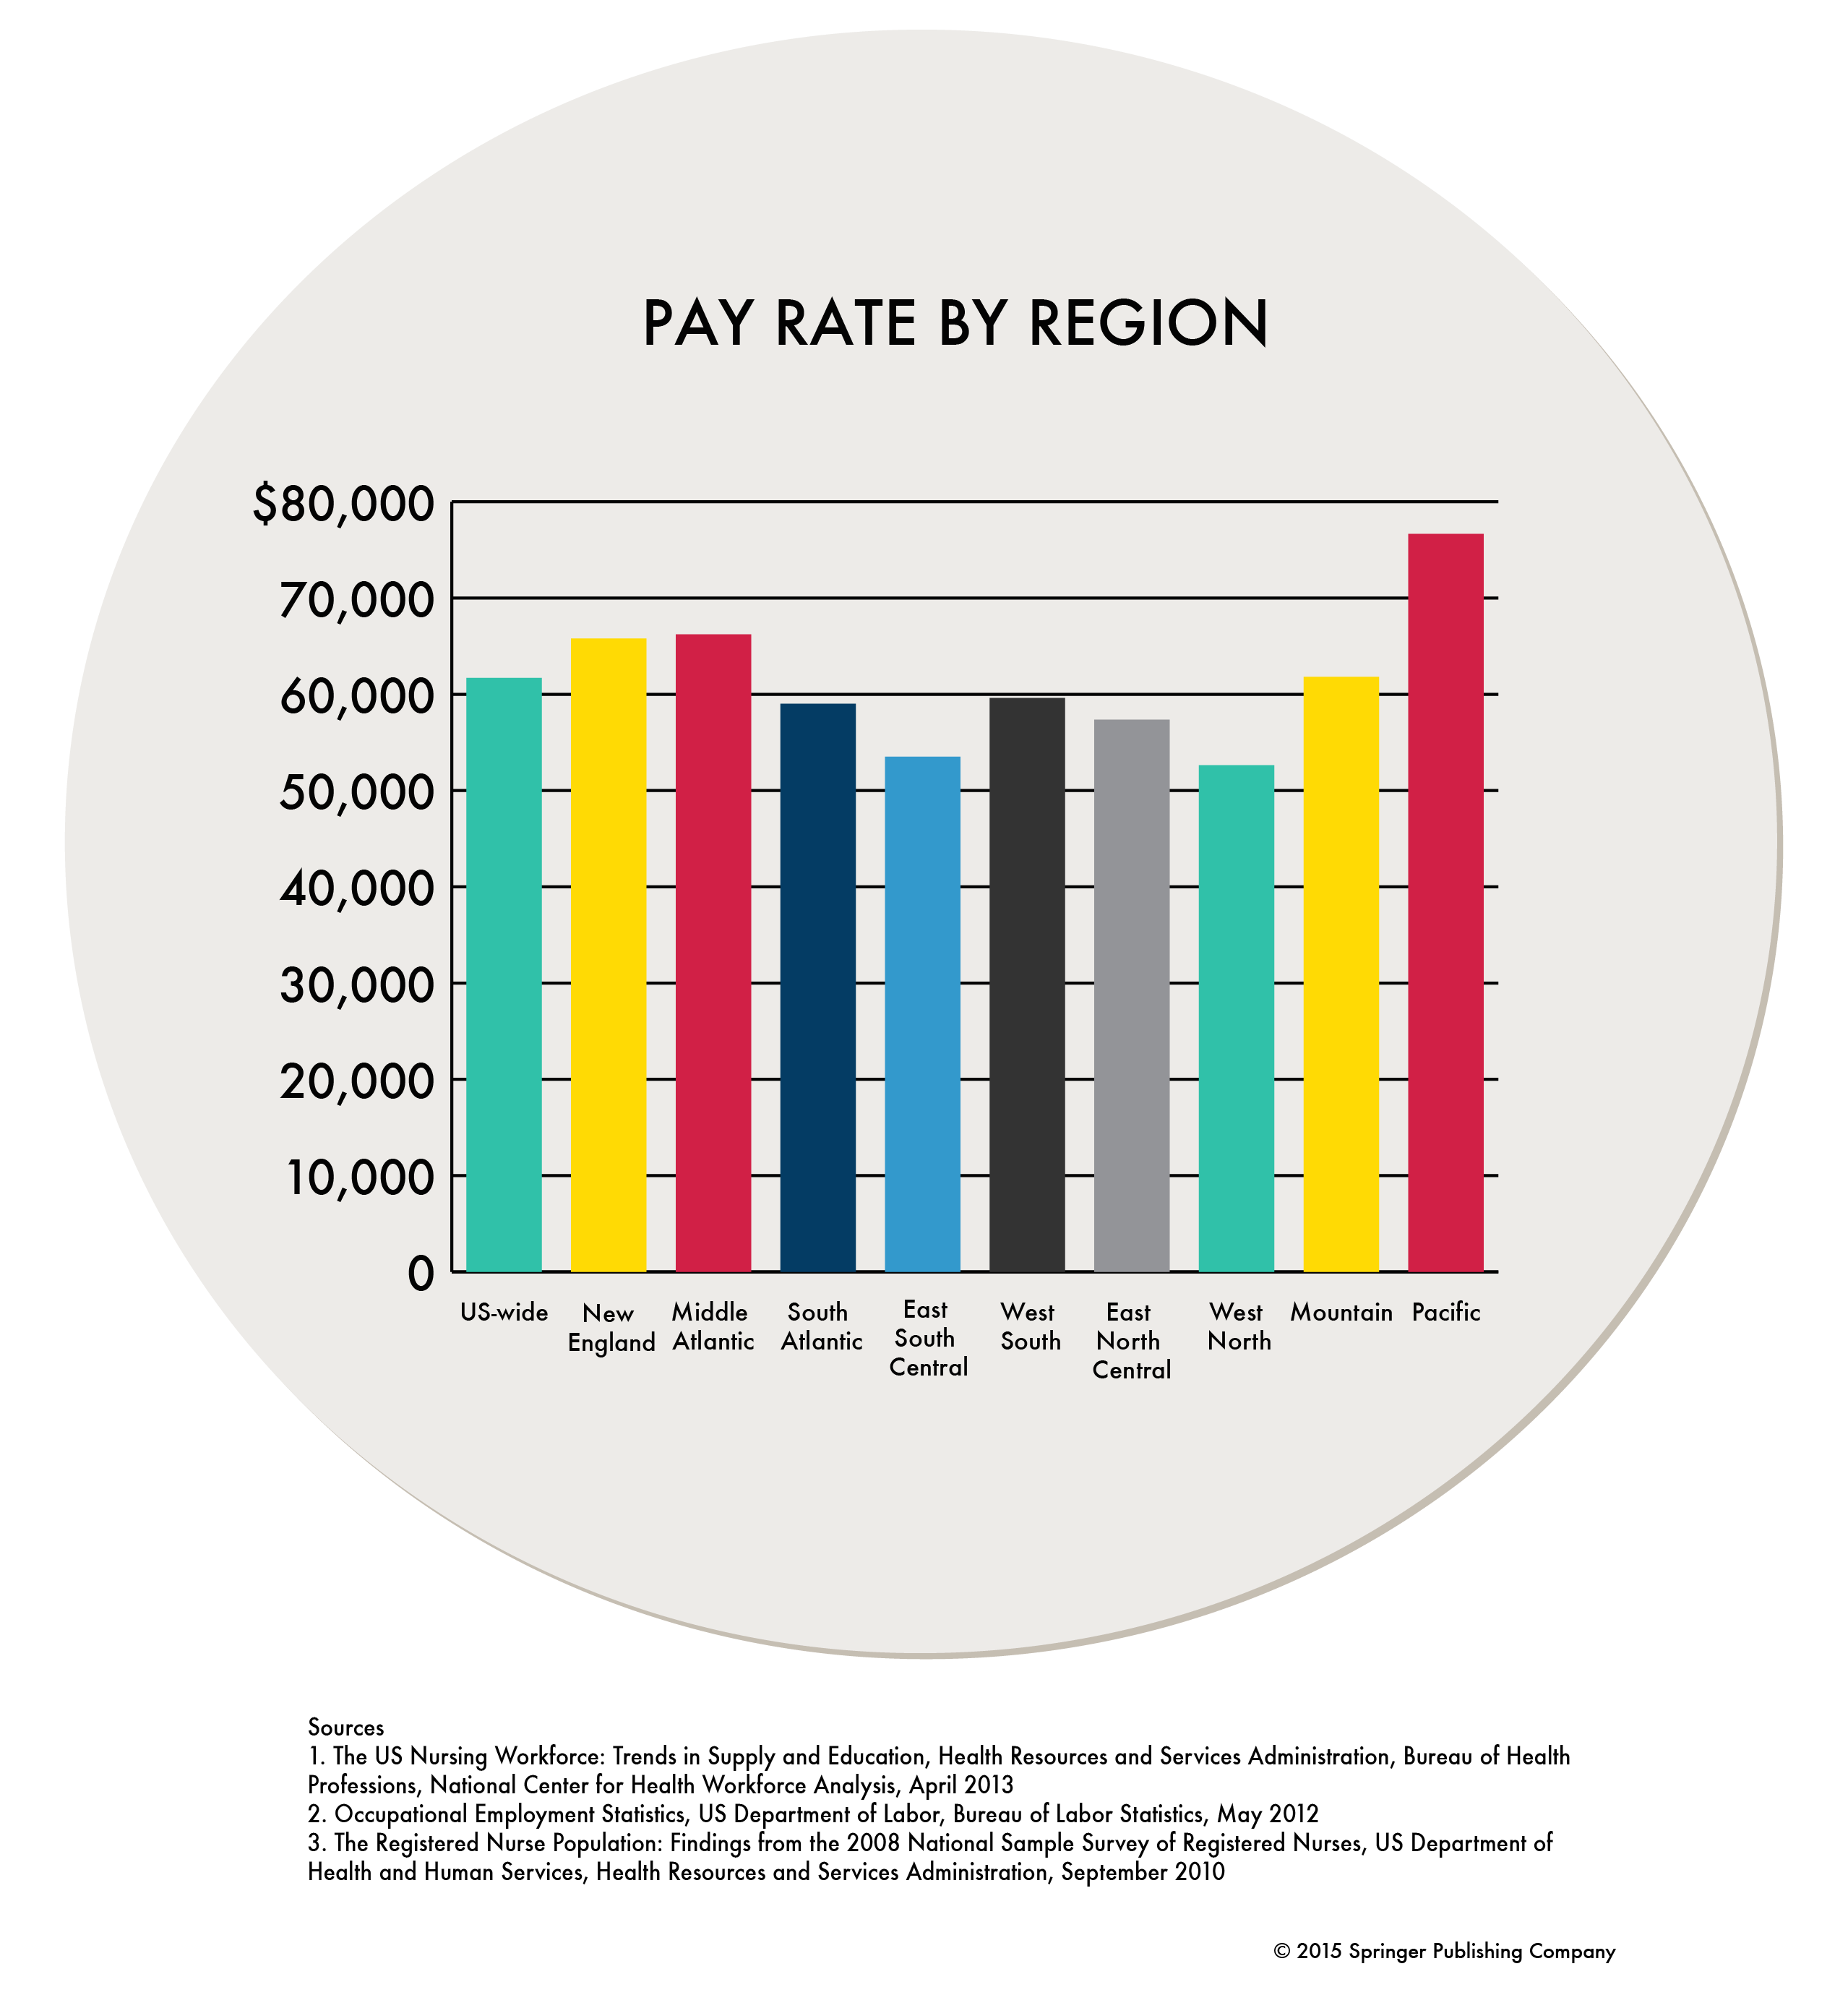
Work/Pay Statistics
What is the average number of hours worked a week by an RN?
• An RN works an average 37 hours a week.
What is the average annual salary for a full-time RN?
• The average annual salary for a full-time employed RN is $67,930.
What is the average annual salary for a full-time LPN?
• The average annual salary for a full-time employed LPN is $42,400.
What are the average annual earnings for a staff nurse?
• The average annual salary for a staff nurse is $61,706.
What is the average salary of a nurse who holds a graduate degree?
• A nurse with a master’s or doctoral degree makes an average $87,363 a year.
Nurse anesthetists (CRNAs) have the highest earnings of all employed nurses, averaging $154,390 annually.

Download the Infographic (Minority Health Statistics)
Sources
1.Data/Statistics, The Office of Minority Health, US Department of Health and Human Services
2. CDC Health Disparities and Inequalities Report — United States, 2013, US Department of Health and Human Services, Centers for Disease Control and Prevention, MMWR 2013;62(Suppl 3):1-187